This post is part three in a three part series on the challenges of improving a production machine learning system. Find part one here and part two here.
A/B Testing
When engineers and data scientists optimize machine learning systems they often focus on improving offline metrics like cross entropy, ROC-AUC, or mean square error on a static holdout set. However, it is rare that these are the most important metrics from a business perspective. Usually the most important business metrics are things like revenue, click-through-rate, or customer report rate. However, it can be difficult to predict the impact of machine learning system improvements on these metrics.
Generally the most reliable way to measure this impact is to run an online A/B test. That is, we launch our new model on a small percentage of traffic and monitor the impact on core business metrics. It is usually a mistake to ship a model or feature improvement without going through this stage. In this section we will discuss some of the most common challenges and pitfalls with running A/B tests on machine learning systems.
Small Traffic and Model Training
In many applications the set of labeled samples that we use to train our models is heavily influenced by the model’s behavior. For example:
- In content moderation applications the samples that the model selects for human review will receive manual labels.
- In recommendation applications users have the opportunity to provide implicit or explicit feedback on the samples that the model recommends them.
However, it is common for A/B tests to only use a small percentage of traffic (1-2%) per bucket. This makes it difficult to train any machine learning model entirely on samples from the A/B test, so we are unlikely to capture this self-influence from the A/B test results. This also makes certain kinds of machine learning system improvements, such as improvements to exploration policies, extremely difficult to test in an A/B setting.
Hidden Shared Variables
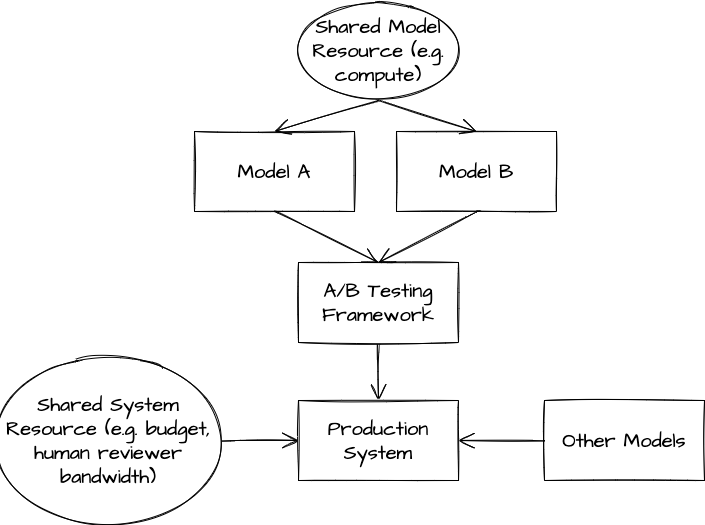
When we run an A/B test, we need to logically separate the samples that model A runs on from the samples that model B runs on. However, it is unlikely that these samples will be entirely separate. Usually a collection of feature flags will control the code paths for fetching features and serving models A and B, but all samples will share many resources like databases, compute clusters, budgets, or other models. As a result, the behavior of model A can influence the product metrics that we measure over the samples served by model B. This can make it challenging to interpret the results of our test.
Example 1: Shared Compute Suppose that model B has substantially lower latency than model A, and we expect that this latency will translate to an improvement in business metrics due to faster system response times. Suppose also that models A and B are served by the same cluster, that requests to this cluster are batched, and that the batched requests are not separated by experiment bucket. We will not be able to observe this latency improvement in an A/B test, since the cluster response times for traffic served by model B will be affected by model A’s latency.
Example 2: Shared Human Bandwidth Suppose that our content moderation system is limited by the bandwidth of human reviewers, who can only take action on the top N reports that are sent to them. Now suppose that models A and B are calibrated differently, such that samples that model B reviews are 2x more likely to be sent to a human reviewer than samples that model A reviews. If the human reviewers are not stratified by experiment bucket, then the majority of human review will take place on samples flagged by model B, which can substantially skew results.
Example 3: Shared Budget Suppose we are running a programmatic advertising auction in which advertisers spend a fixed budget over the course of a day by placing bids on user impressions. Now suppose that we use machine learning to set advertiser bids, and that we apply model A to a portion of auctions and model B to a different portion of auctions. If model B is overcalibrated relative to model A and advertiser budget is not stratified by experiment bucket, then advertisers will spend a greater portion of their budgets on the auctions that model B serves. This could cause model B to show artificially better performance on metrics like revenue and click-through-rate.
Example 4: Shared Downstream Model Suppose that we use a machine learning model to calibrate raw sensor data, and that a classification model elsewhere in the system consumes this processed data in order to classify user activity. This classification model is likely to perform best on sensor data that is calibrated similarly to the data that it was trained on. Now suppose that we run an A/B test on the sensor calibration model but do not separate out the classification model training by experiment bucket. We may see that the experimental model that performs worse at the sensor calibration task shows better overall business metrics.
One of the most insidious aspects of these shared variables is that they are hidden. It is uncommon for a data scientist experimenting with a new model to deeply understand every aspect of the systems that handle model deployment or resource management. As a result, many A/B test analyses are performed as if buckets are independent and these couplings do not exist. This is counterproductive for an organization trying to make the best decisions.
Multiple Comparisons
One of the most well-known limitations of A/B tests is that guarantees around statistical significance fall apart once we start making mutiple comparisons. That is, if we track multiple metrics or run multiple versions of the same test, then it is very likely that we will see p<0.05 differences between buckets that are due to noise.
Computing statistical significance for a test in which we make multiple comparisons requires estimating the family-wise error rate, or the probability of making at least one false discovery along all of the comparisons we perform. However, this is tricky to get right. Although can use techniques like the Bonferroni correction or Holm-Bonferroni method to compute an accurate p-value in the case that each comparison is completely independent, this assumption is usually far too strict. If we are making a double digit number of comparisons, these methods apply an extremely high bar for statistical significance. It is possible to relax the bar on statistical significance if we assume that some comparisons are closely correlated with each other, but this is challenging to model and often subjective.
As a result, the presence or absence of statistical significance tends in practice to be only a data point in the overall analysis of an A/B test. We need to complement it with other tools like:
- Stratification: Did we see consistent improvements across time periods, geos, user segments?
- Fundamental Analysis: Do we have an explanation for this effect, and do the movements of other metrics/other tests support that explanation?
Conclusion
Machine learning systems can be incredibly powerful. They enable software systems to operate successfully in a variety of domains and unlock entirely new kinds of products. However, they are extraordinarily costly to maintain and improve. The experimental and cross-cutting nature of machine learning development is often at odds with standard software processes. Hidden couplings slow down development and can cause even simple changes to produce unexpected results. The difficulty of assessing impact with A/B testing often frustrates progress, especially in larger organizations.
Over this collection of posts (part 1, part 2) we have only scratched the surface of the challenges of machine learning development. For example, machine learning systems often demonstrate emergent behaviors that no single person fully understands or predicts. This can lead to issues with bias and fairness as well as security and reliability.
Many of the ideas in these posts are also discussed in other resources like Machine Learning: The High Interest Credit Card of Technical Debt and Google’s Rules of Machine Learning.