Introduction
There’s a famous scene in the HBO show “The Wire” where the unscrupulous Deputy Commissioner Rawls is addressing the police colonels and majors, and he says:
Gentlemen, the word from on high is that the felony rates district by district will decline by five percent before the end of the year. We are dealing in certainties. You WILL decrease the UCR felonies by the end of the year”

The Baltimore Police Department in the Wire engages in “stat juking,” or making small modifications to reports to create an artificial decrease in the crime rate. For example, aggravated assaults can be downgraded to assaults, and robberies can be downgraded to larcenies. This kind of statistical manipulation is not limited to police departments. People and organizations throughout the world utilize data improperly to prove their point, either through direct manipulation or unintentional misuse.
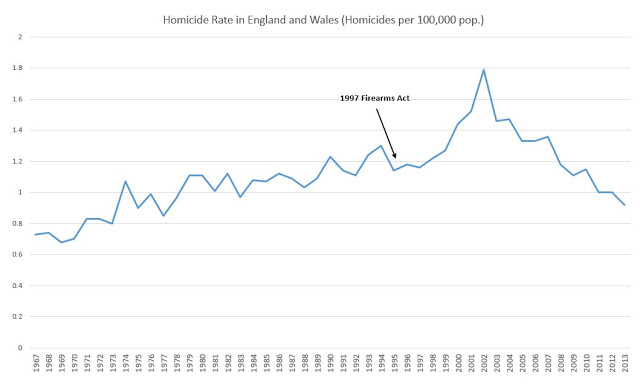
For example, the effectiveness of gun control policies as a tool for reducing gun violence has been debated at length over the past 50 years, and both sides of the debate believe extremely strongly that they are “on the side of the facts.” Gun control programs have been established in various forms in various countries with various cultures throughout the world. However, there is no true metric of “gun control success.” A blog writer with essentially any opinion about gun control will be able to find a study that supports his or her opinion. For example, a pro-gun control writer might find this paper, which shows a strong relationship between gun ownership and firearm homicide rates by state, but does little to control for confounding factors. A pro-gun rights writer might instead choose to cite the increase in homicides in the wake of a firearms control act in the UK as “proof” that gun control actually creates more gun victims (pictured below). In both cases, the writer and their followers feel validated by the “facts” that support them.
Rolling Up and Drilling Down with Simpson’s Paradox
From year 2000 to year 2013, the inflation-adjusted median wage in the US increased. However, for each educational subgroup (high school graduates, college graduates, etc), the median wage decreased. How is this possible? The key is that on average, people with more degrees make more money, and two things happened between year 2000 and year 2013:
- The distribution of educational subgroups shifted, and a larger proportion of the population started getting degrees
- The average value of a degree went down
This is an example of a well known but often misunderstood statistical phenomenon known as Simpson’s Paradox. Since the dawn of statistics, people have used Simpson’s Paradox to reframe experimental results and observations in a way that supports their agendas. An activist rallying about increases in the cost of living may choose to cite the fact that wages for every subgroup have gone down. A conservative speaking out against government wage regulations may instead choose to cite the overall increase in wages. Neither one tells the full story, but both can benefit from the side that they choose to share.
Multiple Testing
Studies performed by academic institutions and published in journals often command a great deal of trust. The papers must be peer reviewed, and the people who produce them seem to have little financial motive to falsify the results. But it’s worth taking a closer look at the process by which these results are produced.
First, most academic studies have a significant portion of the work performed by PhD students or postdoctoral researcher. If the work that they perform is published, their name will be included in the list of authors. In order to get a position as a professor, the researcher must have authorship on a significant number of publications. Similarly, in order for a professor to achieve tenure and funding, they need to continuously produce high impact research. This creates a very strong incentive for researchers to find significant results.
Often researchers use the “\(p\) value” of a test as a way to measure its significance. The logic is simple. Say we are looking for a difference between two groups. If the difference is large enough so that the probability that it occurred by chance is less than (the arbitrarily chosen threshold of) \(5\%\), we say that \(p < 0.05\) and the effect is “significant.” However, there is a subtlety to these kinds of tests that is easy to overlook. Let’s say that you’re a grad student researcher and you’re examining the results of a 5 year study where you had tens of thousands of people drink coffee every morning and tens of thousands people abstain in order to understand the effects of daily coffee consumption on mental well being. First, you examine the rates of anxiety between the coffee drinkers and non-coffee drinkers, and you find no strong relationship. Next, you look at the rates of depression, and you once again find no relationship. Faced with the panic of needing to report to your professor that his or her expensive 5 year study was worthless, you begin to stratify the population and look for rarer disorders. Eventually, you find that there is a “significant” \((p < 0.05)\) increase in the rates of schizophrenia for low income non coffee drinkers in your population. Your professor is happy and you publish the results.
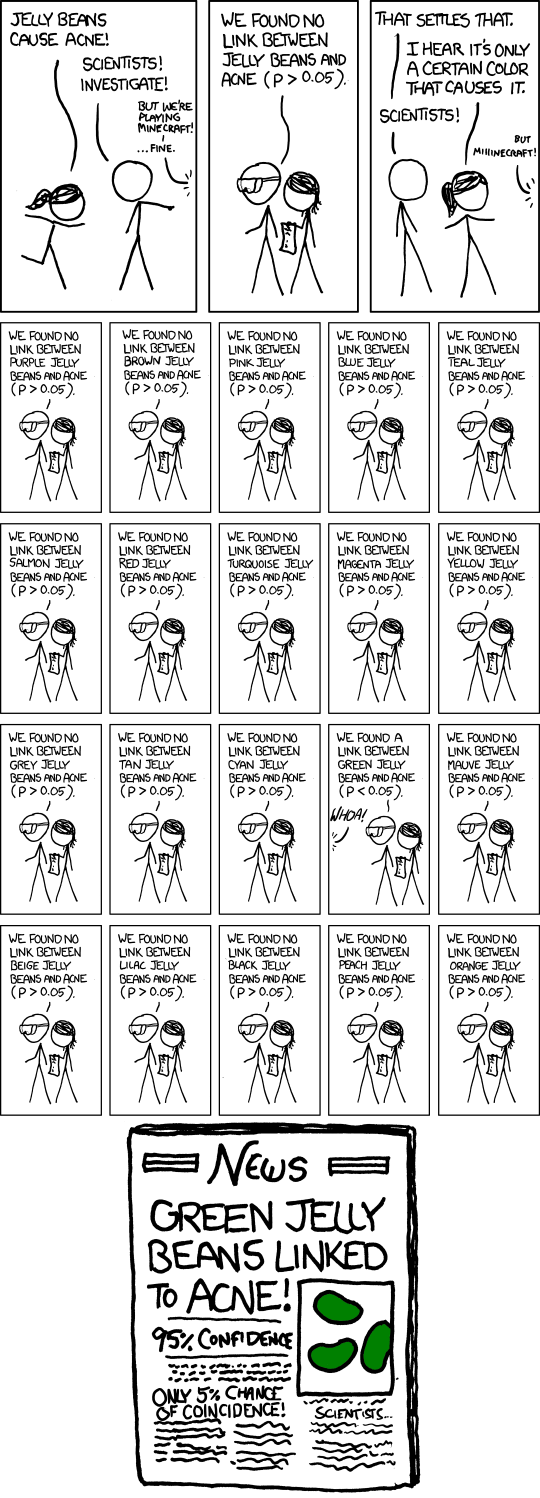
But is this result really significant? Let’s look at the math. Let’s say that you run twenty unrelated studies and get twenty \(p\) values. If none of the studies were actually significant, then on average one of them will produce a \(p\) value less than \(0.05\). Similarly, if you look at the same study in enough independent ways, then you have decent chance of finding something “significant,” even if no effect actually exists 1. This is often referred to as the multiple testing hypotheses problem, and is best illustrated by Randall Munroe below:
Conclusion
Data and Statistics are fickle beasts. In the face of uncertainty, they appear to be our best source of truth. But when used incorrectly, they can lend legitimacy to fallacious opinions and arguments. The fact is, analyzing and understanding data generally requires significant context and follow up investigation. By itself, a data point or even a statistic is rarely particular useful or informative.
-
In reality, if you look at the same study in 20 ways, each “look” is going to be pretty correlated with the other “looks,” so it’s not quite as bad as running 20 different studies. ↩